
 [/vc_column_text][/vc_column][vc_column width=”1/2″][vc_custom_heading text=”Risk Mitigation” use_theme_fonts=”yes” el_class=”col-blu align-left”][vc_column_text]
Single asset risk is mitigated through diversification of an asset basket. Profit from the volatility of exotics, hedged with the stability of metals such as gold. The nature of such a broad-based countdowns would also almost certainly increase the availability of liquidity for short-term countdowns.
[/vc_column_text][/vc_column][/vc_row][vc_row full_width=”stretch_row” content_placement=”middle” css=”.vc_custom_1571990458184{background-color: #f2f2f2 !important;}” el_class=”comman-section”][vc_column width=”1/2″][vc_custom_heading text=”Greater Trading Opportunities” use_theme_fonts=”yes” el_class=”col-blu align-left”][vc_column_text]
Greater volatility which translates to more trading opportunities can also be expected as a wider range of market fundamentals will affect the multiple underlying assets as opposed to a single-asset countdowns.
[/vc_column_text][/vc_column][vc_column width=”1/2″][vc_column_text] [/vc_column_text][/vc_column][/vc_row][vc_row el_class=”comman-section”][vc_column width=”1/2″][vc_custom_heading text=”Multi-Asset Types” font_container=”tag:h2|text_align:center” use_theme_fonts=”yes” el_class=”col-blu align-left”][vc_column_text]
 [/vc_column_text][/vc_column][vc_column width=”1/2″][vc_column_text]


[/vc_column_text][/vc_column][/vc_row][vc_row full_width=”stretch_row” el_class=”comman-section” css=”.vc_custom_1571998589116{background-color: #f2f2f2 !important;}” el_id=”crypto-scrl”][vc_column][vc_custom_heading text=”Crypto Majors-Based Multi-Asset Countdowns” font_container=”tag:h2|text_align:center” use_theme_fonts=”yes” el_class=”cust-heading col-blu”][vc_custom_heading text=”Crypto Majors Index (CMI)” font_container=”tag:h3|text_align:center” use_theme_fonts=”yes” el_class=”mdium-font col-blu”][vc_column_text el_class=”txt-center”]
A multi-asset basket that combines the major cryptocurrencies Bitcoin (BTC), Ethereum (ETH), Litecoin (LTC), Bitcoin Cash (BCH) and Ripple (XRP) into one unique instrument that serves as an overarching indication of change in value of the digital asset markets.
[/vc_column_text][vc_custom_heading text=”The Components” font_container=”tag:h3|text_align:center” use_theme_fonts=”yes” el_class=”mdium-font col-blu”][vc_row_inner el_class=”crpt-iner”][vc_column_inner width=”1/12″][vc_column_text] [/vc_column_text][/vc_column_inner][vc_column_inner width=”11/12″][vc_column_text]Bitcoin (BTC/USD) – The digital currency with the largest market capitalisation, Bitcoin is based on a distributed ledger technology and fully decentralized unlike traditional currencies which are maintained by central banks. Bitcoins are created through a mining process with a finite supply. [/vc_column_text][/vc_column_inner][/vc_row_inner][vc_row_inner el_class=”crpt-iner”][vc_column_inner width=”1/12″][vc_column_text]
 [/vc_column_text][/vc_column_inner][vc_column_inner width=”11/12″][vc_column_text]Ethereum (ETH/USD) – Ethereum is an open source, distributed computing platform with Ether as the native token used to pay for transactions made on the Ethereum platform. Transaction fees or “gas” rewards miners for computation effort and resources contributed to the platform. It also incentivises developers to code efficiently through smart contracts. [/vc_column_text][/vc_column_inner][/vc_row_inner][vc_row_inner el_class=”crpt-iner”][vc_column_inner width=”1/12″][vc_column_text]
 [/vc_column_text][/vc_column_inner][vc_column_inner width=”11/12″][vc_column_text]Litecoin (LTC/USD) – Litecoin is an early spinoff of bitcoin and is a peer-to-peer cryptocurrency and open-source software project. It’s most notable difference from bitcoin is the faster transaction time. Due to the many similarities shared, Litecoin is often regarded as the silver to bitcoin’s gold. [/vc_column_text][/vc_column_inner][/vc_row_inner][vc_row_inner el_class=”crpt-iner”][vc_column_inner width=”1/12″][vc_column_text][/vc_column_text][/vc_column_inner][vc_column_inner width=”11/12″][vc_column_text]Bitcoin Cash (BCH/USD) – Another spinoff of bitcoin, Bitcoin Cash is the result of a fork in Bitcoin. The blocks in Bitcoin Cash are eight times larger than that of bitcoin and as a result more transactions are able to be processed with a lower fee.
[/vc_column_text][/vc_column_inner][/vc_row_inner][vc_row_inner el_class=”crpt-iner”][vc_column_inner width=”1/12″][vc_column_text] [/vc_column_text][/vc_column_inner][vc_column_inner width=”11/12″][vc_column_text]Ripple (XRP/USD) – XRP is the fundamental token of the Ripple network that facilitates currency exchange and remittance. Its settlement infrastructure has been adopted by traditional banks and payment system networks for fast and secure money transfers.[/vc_column_text][/vc_column_inner][/vc_row_inner][/vc_column][/vc_row][vc_row el_id=”geog-scrl”][vc_column][vc_custom_heading text=”Geographical-Based Multi-Asset Countdowns” font_container=”tag:h2|text_align:center” use_theme_fonts=”yes” el_class=”cust-heading col-blu”][vc_column_text el_class=”txt-center”]These Multi-Asset Countdowns are a hybrid between indices and currency pairs, comprising of a weighted basket of underlying assets categorized by geographic regions. [/vc_column_text][vc_row_inner el_class=”comman-section map-sect-wrap”][vc_column_inner width=”1/3″][vc_column_text]
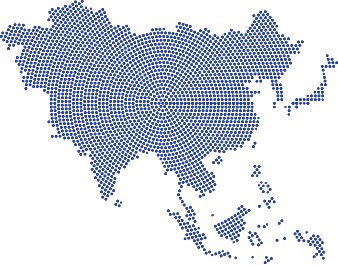
An Asian orientated index with main exposure to Japan and China coupled with diversification in the pacific rim. Underlying assets that make up the index include the major currencies Yen (JPY), Australian Dollar (AUD) and New Zealand (NZD) dollar as well as major indices HIS (Han Seng), SSEC (Shanghai Composite) and N225 (Nikkei 225).
[/vc_column_text][/vc_column_inner][vc_column_inner width=”1/3″][vc_column_text]
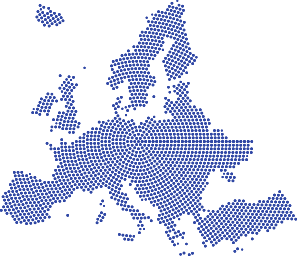
The Europe Index emphasizes on the region’s larger and more developed markets which include Germany, France, Switzerland and Britain. Underlying assets that make up the index include the major currencies Euro Dollar (EUR), British Pound (GBP), Swiss Franc (CHF) as well as major indices DAX (Frankfurt Stock Exchange), FTSE (London Stock Exchange), SMI (Swiss Stock Exchange) and CAC 40 (pan-European stock exchange).
[/vc_column_text][/vc_column_inner][vc_column_inner width=”1/3″][vc_column_text]
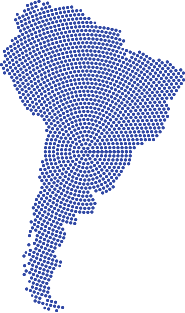
A unique composite of north and south American assets with main exposure on the United states of America, Canada, Brazil and Argentina. Underlying assets that make up the index include the major currencies US Dollar (USD), Canadian Dollar (CAD) as well as major indices MerVal (Buenos Aires Stock Exchange) , BVSP (BM&F Bovespa Stock exchange), S&P TSX Composite (Toronto Stock Exchange), DJI (Dow Jones), NASDAQ Composite and S&P 500 Index.
[/vc_column_text][/vc_column_inner][/vc_row_inner][/vc_column][/vc_row][vc_row full_width=”stretch_row” el_class=”comman-section ind-bsd-sect” css=”.vc_custom_1571999693095{background-color: #f2f2f2 !important;}” el_id=”inds-scrl”][vc_column][vc_custom_heading text=”Industry/Class-Based Multi-Asset Countdowns” font_container=”tag:h2|text_align:center” use_theme_fonts=”yes” el_class=”cust-heading col-blu”][vc_column_text el_class=”txt-center”]These indices share a common characteristic of providing a broad overview of the respective industries and asset class.[/vc_column_text][vc_row_inner][vc_column_inner width=”1/6″][vc_column_text] [/vc_column_text][/vc_column_inner][vc_column_inner width=”5/6″][vc_custom_heading text=”METALS Index” font_container=”tag:h3|text_align:left” use_theme_fonts=”yes” el_class=”mdium-font col-blu”][vc_column_text]Designed for traders to gain direct exposure to the metals market, the METALS Index comprises of both base metals and precious metals weighted based on global production volume and trade liquidity averaged over the preceding five-year period. For the base metals component, the six primary non-ferrous constituent metals are Aluminium (99.5% purity) , Copper (Grade A Cathode), Lead (99.97% purity), Nickel (Melting Grade), Tin (99.85% purity) and Zinc (99.995% purity). The precious metals component consists of Gold (XAU), Silver (XAG), Platinum (XPT) and Palladium (XPD). Underlying assets are U.S. dollar denominated and corresponding unit of measurement per contract for all precious metals are troy ounce (t oz) and metric ton (MT) for all base metals except copper which is in pounds (lb). [/vc_column_text][/vc_column_inner][/vc_row_inner][vc_row_inner][vc_column_inner width=”1/6″][vc_column_text]
 [/vc_column_text][/vc_column_inner][vc_column_inner width=”5/6″][vc_custom_heading text=”COMMODITIES Index” font_container=”tag:h3|text_align:left” use_theme_fonts=”yes” el_class=”mdium-font col-blu”][vc_column_text]The COMMODITIES Index offers traders significant global exposure to the two principal commodity groups – Energy and Agriculture. Covering wide spectrums of the commodity sector, the COMMODITIES Index emphasizes diversification and liquidity. Individual asset weightage is determined by its liquidity and production data in a 2:1 ratio subjected to further requirements for diversification. Underlying assets of the main sector “Energy” group includes WTI Crude Oil, Brent Crude Oil , Unleaded Gasoline and Natural Gas. The “Agriculture” group is further diversified into the sub sectors “Grains” and “Softs”. Components of “Grains” include Corn, Soya bean and Wheat, whereas components of “Softs” include Cotton, Sugar and Cocoa. Index is calculated in U.S. dollar denominated terms. [/vc_column_text][/vc_column_inner][/vc_row_inner][vc_row_inner][vc_column_inner width=”1/6″][vc_column_text]
 [/vc_column_text][/vc_column_inner][vc_column_inner width=”5/6″][vc_custom_heading text=”EXOTICS Index” font_container=”tag:h3|text_align:left” use_theme_fonts=”yes” el_class=”mdium-font col-blu”][vc_column_text]The EXOTICS Index provide traders the rare opportunity to trade on some of the most highly volatile currencies in the world without exposure to excessive risks and illiquid market conditions that are otherwise often associated with exotic currencies. The consolidated liquidity of a broad based basket provides for greater activity and fluctuations necessary for profit yields and couples as a portfolio diversification to that of major currencies trading. Exotic currencies in the basket represent emerging or strong but smaller economies on a global perspective from Asia, Middle East, Africa and European countries outside of the Euro Zone. Underlying Assets include Turkish Lira (TRY), Swedish Krona (SEK), Norwegian Krone (NOK), Danish Krone (DKK), South African Rand (ZAR), Saudi Riyal (SAR), Hong Kong Dollar (HKD), Singapore Dollar (SGD), Offshore Chinese Yuan (CNH) and Indian Rupee (INR). [/vc_column_text][/vc_column_inner][/vc_row_inner][/vc_column][/vc_row][vc_row full_width=”stretch_row” el_class=”comman-section” el_id=”curn-scrl”][vc_column][vc_custom_heading text=”Currency Strength-Based Multi-Asset Countdowns” font_container=”tag:h2|text_align:center” use_theme_fonts=”yes” el_class=”cust-heading col-blu”][vc_column_text]Currency Strength Indices measures the value of an underlying currency relative to other major currencies using a pre-defined currency basket. It is a reflection of many factors related to the underlying currency including fundamental data, overall economic performance and interest rates. Currency Strength Indices grants traders huge exposure to the predominant trend of the underlying currency. A rising index indicates an appreciation of the underlying currency against the counterpart currencies in the currency basket, a falling index in contrast, indicates a devaluation.[/vc_column_text][vc_column_text]The Currency Strength indices are weighted using data from the Bank for International Settlements (BIS) on total foreign exchange (FX) trading volume. The BIS is a supranational organization of central banks that provides triennial data, allowing for continually updated indices. The Currency Strength Indices Countdowns offered are based on the world’s most liquid currencies which represent more than 90% of the averaged $5.1 trillion USD daily turnover volume.[/vc_column_text][vc_row_inner][vc_column_inner width=”1/2″][vc_custom_heading text=”USDOLLAR Index (USDbo)” font_container=”tag:h4|text_align:left” use_theme_fonts=”yes” el_class=”col-blu”][vc_column_text]The US dollar accounted for more than 87% of all foreign exchange market turnover. Counter Currencies in the basket consists of the Euro Dollar (EUR), Australian dollar (AUD), British Pound (GBP), New Zealand Dollar (NZD), Canadian Dollar (CAD), Swiss Franc (CHF) and Japanese Yen (JPY).[/vc_column_text][/vc_column_inner][vc_column_inner width=”1/2″][vc_custom_heading text=”POUND Index (GBPbo)” font_container=”tag:h4|text_align:left” use_theme_fonts=”yes” el_class=”col-blu”][vc_column_text]The British Pound accounted for more than 12% of all foreign exchange market turnover. Counter Currencies in the basket consists of the US Dollar (USD), Euro Dollar (EUR), Swiss Franc (CHF) and Japanese Yen (JPY).[/vc_column_text][/vc_column_inner][/vc_row_inner][vc_row_inner][vc_column_inner width=”1/2″][vc_custom_heading text=”EURODOLLAR Index (EURbo)” font_container=”tag:h4|text_align:left” use_theme_fonts=”yes” el_class=”col-blu”][vc_column_text]The Euro dollar accounted for more than 31% of all foreign exchange market turnover. Counter Currencies in the basket consists of the US Dollar (USD), British Pound (GBP), Swiss Franc (CHF) and Japanese Yen (JPY).[/vc_column_text][/vc_column_inner][vc_column_inner width=”1/2″][vc_custom_heading text=”AUDDOLLAR Index (AUDbo)” font_container=”tag:h4|text_align:left” use_theme_fonts=”yes” el_class=”col-blu”][vc_column_text]The Australian Dollar accounted for close to 7% of all foreign exchange market turnover. Counter Currencies in the basket consists of the US Dollar (USD), Canadian Dollar (CAD), Japanese Yen (JPY) and New Zealand Dollar (NZD).[/vc_column_text][/vc_column_inner][/vc_row_inner][vc_row_inner][vc_column_inner width=”1/2″][vc_custom_heading text=”YEN Index (JPYbo)” font_container=”tag:h4|text_align:left” use_theme_fonts=”yes” el_class=”col-blu”][vc_column_text]The Japanese Yen accounted for more than 21% of all foreign exchange market turnover. Counter Currencies in the basket consists of the US Dollar (USD), Euro Dollar (EUR), Australian Dollar (AUD), British Pound (GBP), Swiss Franc (CHF) and New Zealand Dollar (NZD).[/vc_column_text][/vc_column_inner][vc_column_inner width=”1/2″][vc_custom_heading text=”CADDOLLAR Index (CADbo)” font_container=”tag:h4|text_align:left” use_theme_fonts=”yes” el_class=”col-blu”][vc_column_text]The Canadian Dollar accounted for more than 5% of all foreign exchange market turnover. Counter Currencies in the basket consists of the US Dollar (USD), Australian Dollar (AUD), Swiss Franc (CHF) and New Zealand Dollar (NZD).
[/vc_column_text][/vc_column_inner][/vc_row_inner][vc_row_inner][vc_column_inner width=”1/2″ offset=”vc_hidden-sm”][/vc_column_inner][vc_column_inner width=”1/2″][vc_custom_heading text=”FRANC Index (CHFbo)” font_container=”tag:h4|text_align:left” use_theme_fonts=”yes” el_class=”col-blu”][vc_column_text]The Swiss Franc accounted for close to 5% of all foreign exchange market turnover. Counter Currencies in the basket consists of the US Dollar (USD), Euro Dollar (EUR), British Pound (GBP), Canadian Dollar (CAD) and Japanese Yen (JPY).[/vc_column_text][/vc_column_inner][/vc_row_inner][vc_row_inner el_class=”sml-para”][vc_column_inner][vc_column_text el_class=”sml-para”]
Note: All turnover percentages have been adjusted for local and cross-border inter-dealer double-counting as 2 currencies are involved in every transaction.
[/vc_column_text][/vc_column_inner][/vc_row_inner][/vc_column][/vc_row][vc_row full_width=”stretch_row” el_class=”comman-section pg-bottom-section” css=”.vc_custom_1571991742153{background-color: #f2f2f2 !important;}”][vc_column][vc_custom_heading text=”Countdown to Your Success Today!” font_container=”tag:h2|text_align:center” use_theme_fonts=”yes” el_class=”cust-heading col-blu”][vc_column_text]
[/vc_column_text][/vc_column][/vc_row]